Help Scout Dashboard on TV: Setup Guide for Wallboards

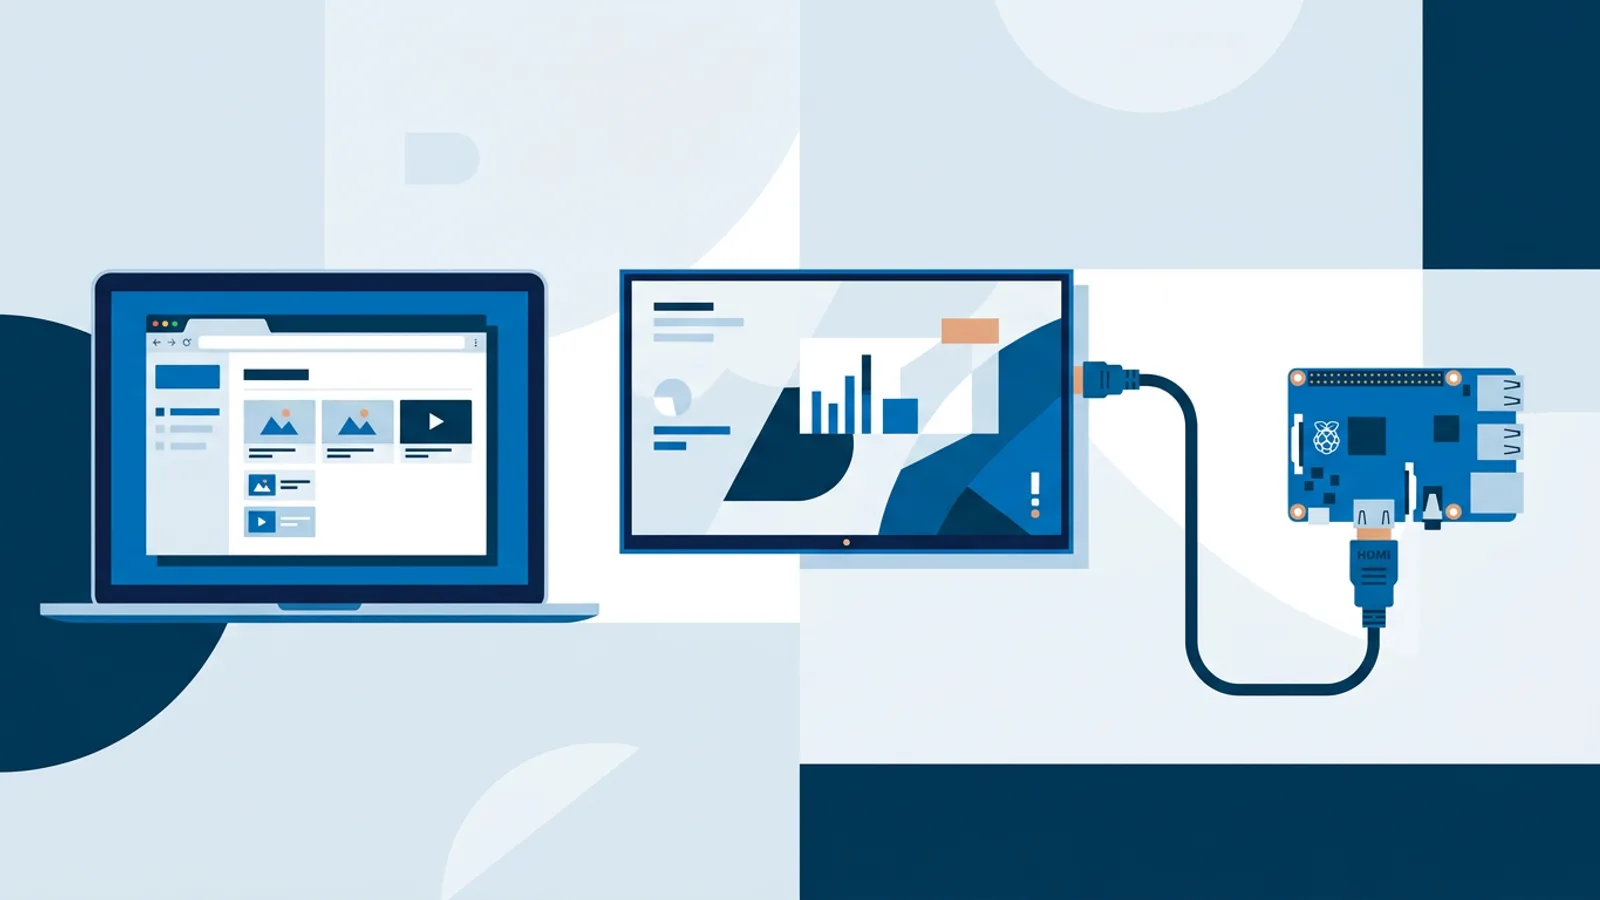
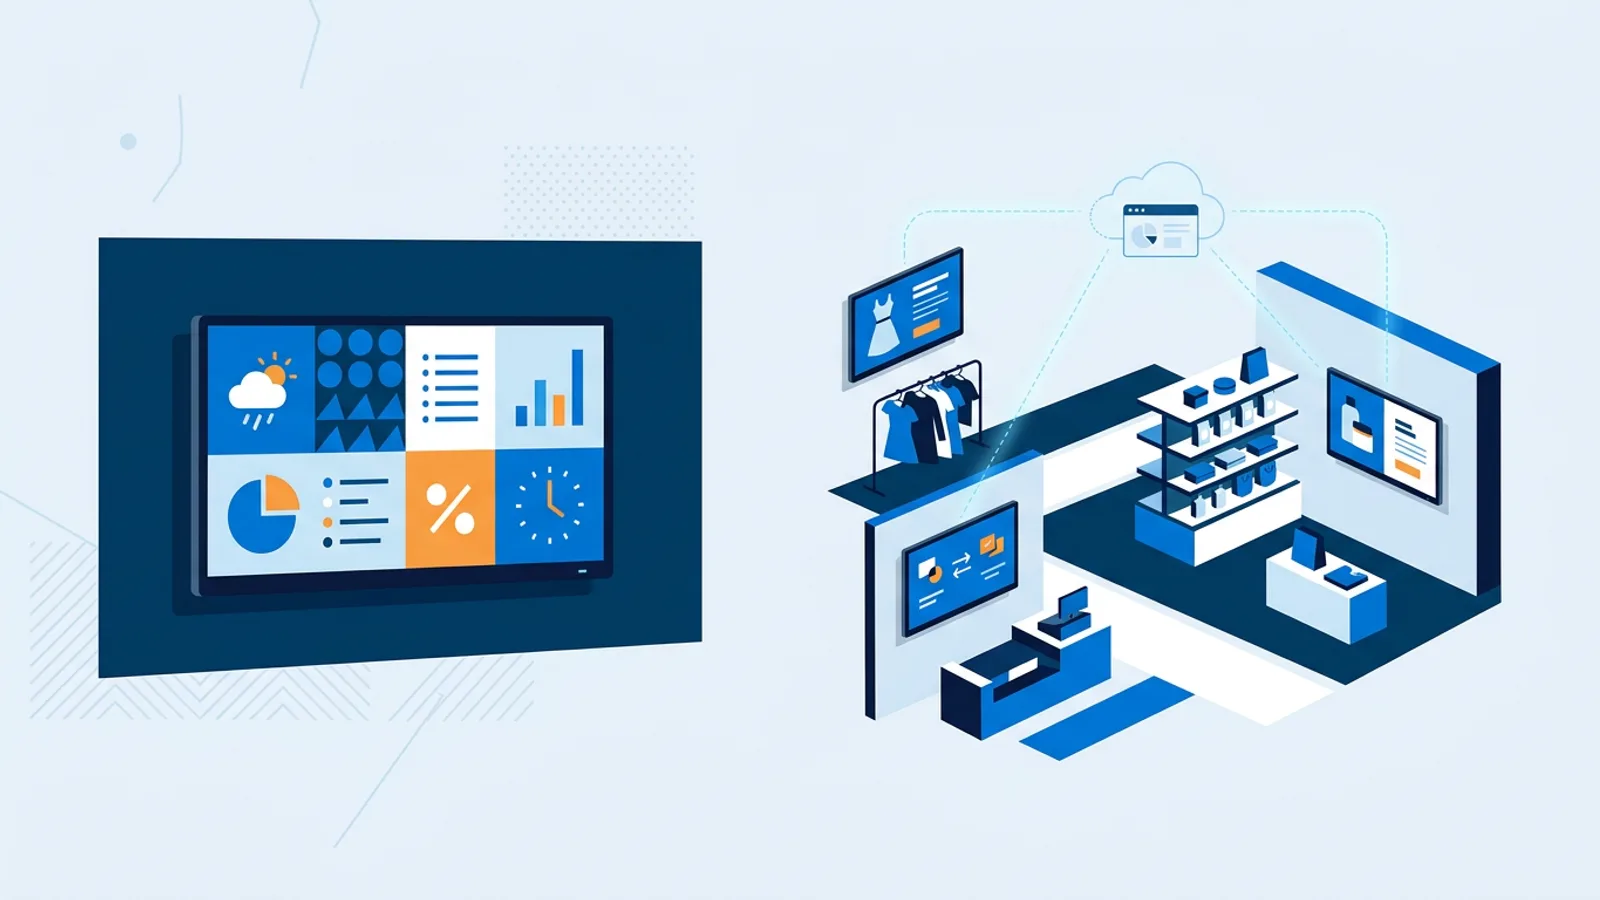
A help scout dashboard on tv screen solves a specific problem: the support team knows the queue is backing up, but nobody outside the team sees it until a customer complains on Twitter. Put the numbers on a wall and the whole team feels the same pressure at the same time, without a stand-up meeting. TVpilot connects to Help Scout natively and shows open, unassigned and waiting conversations, reply and resolution times, and CSAT on any screen in the room. If your team runs Zendesk or Freshdesk, there's no native connector for either yet, and this guide is upfront about that, with two workarounds that actually hold up. For the full list of what's supported today, check the support dashboard integrations page.
This isn't a Help Scout vs Zendesk vs Freshdesk comparison. It's a practical guide to getting support numbers onto a screen, whichever help desk you're already paying for.
What the Help Scout dashboard actually shows
TVpilot's Help Scout integration pulls live numbers using one App ID and App Secret from your own Help Scout account. No ticket content leaves Help Scout. The dashboard shows:
| Metric | What it tells the team |
|---|---|
| Open, unassigned, waiting conversations | How big the queue is right now |
| New and solved today / this week | Whether the team is keeping pace |
| First reply time | How fast customers hear back |
| Resolution time | How long a conversation stays open end to end |
| First-contact resolution | Share of conversations closed in one reply |
| Satisfaction (CSAT) | Whether speed is coming at the cost of quality |
| Split by inbox, channel, tag | Where the load is concentrated |
That's the full set. There's no ticket subject line, no customer name, no message body on screen. Only totals reach the display, by design, which is also why this works as something you can leave running in an open office or a break room without a privacy conversation.
Setting up the Help Scout dashboard
The setup takes a few minutes if you have admin access to the Help Scout account:
- In Help Scout, go to your account's developer settings and create a new app to get an App ID and App Secret (Help Scout calls this "My Apps" under API/webhooks).
- In TVpilot, add the Help Scout plugin and paste in the App ID and App Secret.
- Pick which tiles to show: queue counts, reply/resolution time, CSAT, and the inbox/channel/tag splits you actually care about. You don't have to show everything Help Scout can report.
- Drop the plugin into a playlist and assign that playlist to a screen, or add it alongside other slides (a clock, a countdown to a deadline, a weather widget) if the screen isn't dedicated to support metrics alone.
- Press "Push to screen." Like every other plugin in TVpilot, edits save as a draft first, so you can adjust tiles without anything half-finished showing up on the wall.
From there the numbers refresh on their own. Nobody has to remember to update a spreadsheet or re-export a report.
Which numbers actually belong on a support wallboard
It's tempting to cram every available metric onto the screen because the option exists. In practice, a support ticket dashboard for tv works better with fewer numbers shown bigger. A queue of six tiles that nobody can read from across the room does less than three tiles in a large, clear layout.
A reasonable starting set for most teams:
- Open and waiting conversations (the queue size, the number that matters most minute to minute)
- First reply time today (the leading indicator that things are slipping)
- CSAT this week (the number that keeps speed honest)
Add the inbox or channel split only if your team actually splits work by inbox or channel day to day. If everyone answers everything from one shared queue, that breakdown is just noise on the screen.
Using "Show now" and scheduling around shift changes
Two scheduling tools are worth knowing about for a support wallboard specifically.
"Show now" pushes a playlist to one or more screens immediately, for 30 minutes, an hour, until a chosen time, or indefinitely, after which the screen goes back to whatever it was already playing. That's useful right before a shift handover: push the Help Scout dashboard full-screen for the last 15 minutes of a shift so the outgoing team can see exactly what they're handing off, then let it fall back automatically to the regular rotation.
For something that repeats every day, the calendar's weekly repeating time slots handle it without anyone touching a button. Set the support dashboard to run every weekday from, say, 16:45 to 17:15 if that's when shifts change, and it happens on its own from then on. If nothing is scheduled, the screen falls back to its default playlist, so there's no risk of the screen going blank if a slot is misconfigured.
No native Zendesk or Freshdesk dashboard yet, here's what to do instead
TVpilot doesn't have a native Zendesk tv dashboard or Freshdesk wallboard connector at the moment. Rather than pretend otherwise, here are two approaches that actually work today for teams on either platform.
Option 1: Power BI report as the wallboard. If your team (or your ops/BI person) can pull Zendesk or Freshdesk data into Power BI, either through each platform's own connector or a scheduled export, build a simple report with the queue and reply-time numbers you want visible. In Power BI, use File > Embed report > Publish to web to get a public link, then paste that link into TVpilot's Power BI plugin. It plays full-screen and refreshes on its own. One honest caveat: "Publish to web" makes that report viewable to anyone with the link, so only put wallboard-safe aggregates in it, not anything you wouldn't want leaving the building.
Option 2: A published Looker Studio or Google Sheets report as a web page slide. If your team already builds a Zendesk or Freshdesk report in Google's Looker Studio (formerly Data Studio) or even a live Google Sheet, publish it to the web to get a public URL, then add that URL as a regular web page slide in a TVpilot playlist. TVpilot plays web pages, images, videos and PDFs in the same playlist, so this slots in next to anything else already on the screen. It won't refresh as instantly as a native API connection would, and you're relying on whatever refresh interval the report itself uses, but it's a workable freshdesk wallboard or Zendesk tv dashboard until (or unless) a native connector exists.
Both routes put real numbers on a help desk tv display without inventing an integration that isn't there. If neither is practical for your team right now, that's worth knowing before you invest setup time.
When TVpilot is, and isn't, the right fit here
TVpilot's Help Scout dashboard is a good fit if your team already runs Help Scout and wants a live wallboard without building anything: connect one App ID and App Secret, pick tiles, push to screen, done. It's included on every plan, including the free one, so a single-screen support corner can try it without a credit card.
It's not the right fit if you need native, real-time Zendesk or Freshdesk metrics without a BI detour, or if you need ticket-level detail on the screen itself (TVpilot deliberately keeps individual conversation content off the display). If your reporting already lives entirely inside Zendesk's or Freshdesk's own dashboards and nobody wants to maintain a Power BI report on top, a wallboard through TVpilot adds a step your team may not want.
For a broader look at what belongs on an internal team screen beyond support metrics, the guide on office digital signage and team dashboards covers KPI boards more generally, and the screen monitoring guide is worth a read if the wallboard itself needs to stay reliably online during a busy shift.
If you're on Help Scout, connecting the dashboard is a same-afternoon job. Sign up free, add the Help Scout plugin, and get the queue numbers on the wall before your next shift change.
Frequently asked questions
Does TVpilot support a Zendesk or Freshdesk dashboard natively?
Not yet. TVpilot has a native Help Scout dashboard today, but no direct Zendesk or Freshdesk connector. The practical workaround is building a Power BI report from your Zendesk or Freshdesk data and publishing it to the web, or publishing an existing Looker Studio or Google Sheets report and playing that public link as a web page slide in a TVpilot playlist.
What Help Scout data actually appears on the screen, and is it private?
Only aggregate totals: counts of open, unassigned and waiting conversations, new and solved counts, first reply and resolution time, first-contact resolution, satisfaction score, and splits by inbox, channel or tag. No individual ticket subject, customer name or message content ever reaches the screen.
How do I get the Help Scout App ID and App Secret for TVpilot?
In your Help Scout account, go to the developer/API settings and create a new app (Help Scout lists this under My Apps). That gives you an App ID and App Secret, which you paste directly into TVpilot's Help Scout plugin to connect the dashboard.
Can I make the support dashboard show automatically during shift changes?
Yes, two ways. Use "Show now" to push the dashboard full-screen immediately for a set duration, useful for an ad hoc handover. Or set a weekly repeating time slot in the schedule calendar, for example every weekday from 16:45 to 17:15, so it displays automatically every day without anyone pressing a button.