Support Wallboard: The Seven Numbers to Put on the Wall
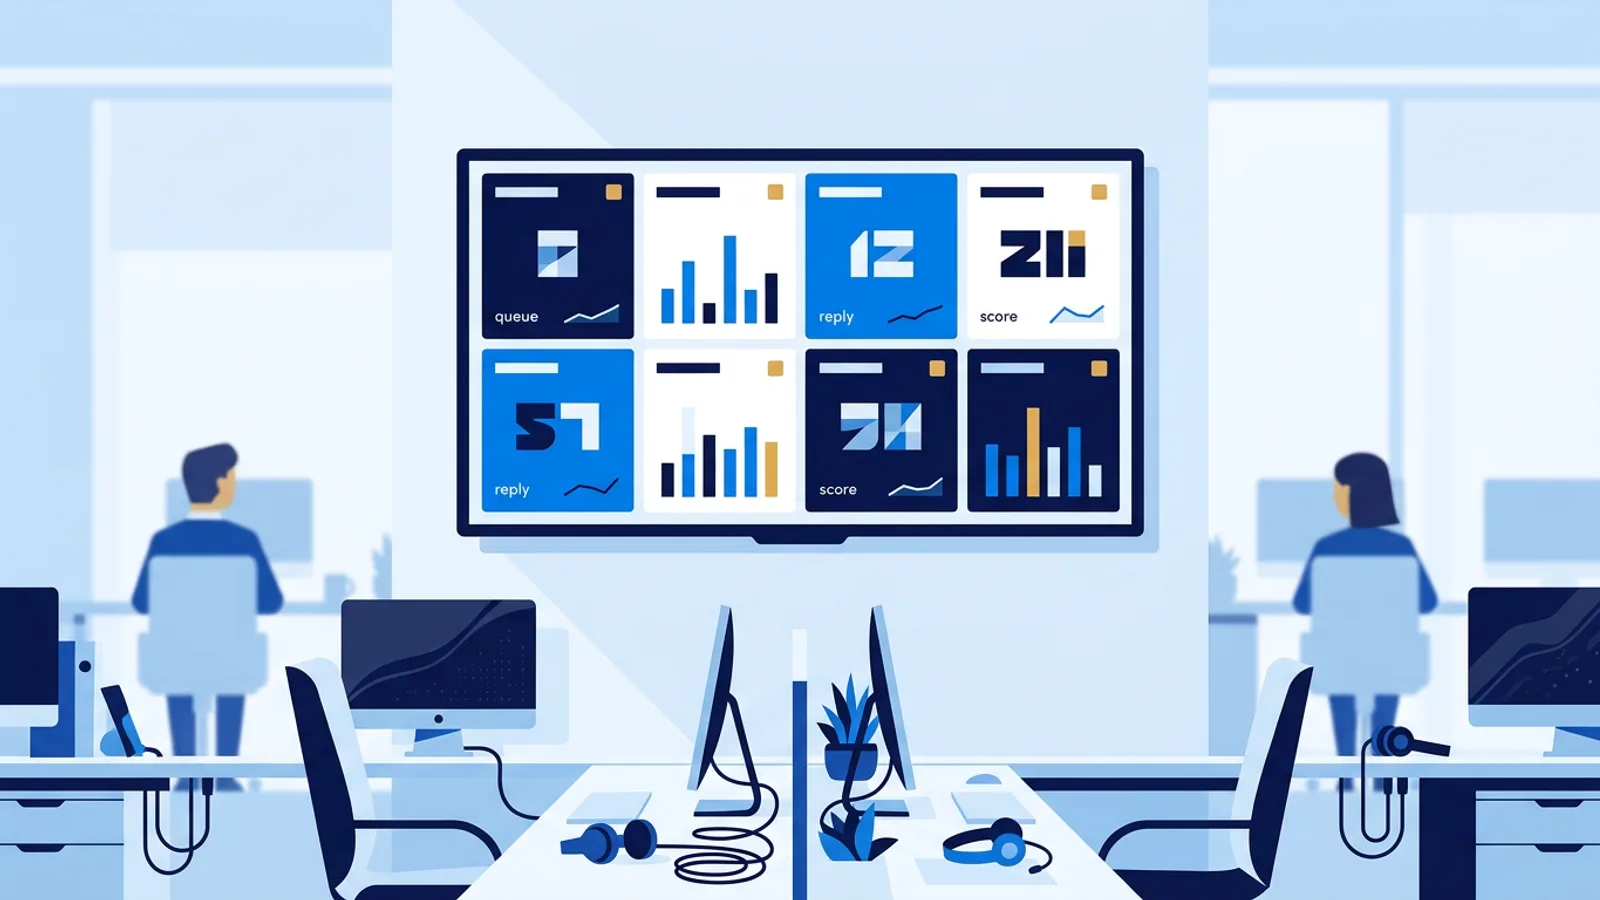
A support wallboard is only useful if people glance at it for two seconds and know whether the queue is fine or on fire. Cramming in every metric a helpdesk can export turns the TV into wallpaper nobody reads. Picking seven numbers, agreeing on what "bad" looks like for each, and letting the screen stay quiet until something needs attention solves that.
If you run a helpdesk like Help Scout, Zendesk, Freshdesk, Intercom or Trengo, this data already sits in your reporting. The job is pulling the right slice onto a screen in the support room or near the desks, using the numbers your helpdesk already tracks. TVpilot connects to Help Scout today, and the support wallboard overview lists which helpdesks are covered, so check there first if your team runs on another one.
The seven numbers worth a spot on the support wallboard
The shortlist, in the order they usually matter during a shift:
- Open: total conversations currently open across the team.
- Unassigned: conversations nobody has claimed yet. This is the one most likely to need action.
- Waiting too long: conversations sitting on your team for a reply. Some tools let you count only conversations past a target. The TVpilot Help Scout tile shows the waiting count, and your team reads that number against the limit it agreed on.
- New today: how many conversations came in since midnight, so people can see if it's a quiet or heavy day.
- Solved today: the counterweight to "new today", a quick gut check on whether the team is keeping pace.
- First reply time: average or median time to first response. It is the wait a customer feels most directly, because it measures how long they hear nothing after writing in.
- Satisfaction: CSAT or equivalent, so the team sees quality alongside speed.
Seven numbers cover volume, backlog, speed and quality without needing a legend or a tutorial. If you can only fit five on a screen comfortably, drop "new today" and "solved today" first. They're useful context but the least actionable in the moment.
Why not just show everything the helpdesk offers
Helpdesks like Zendesk and Freshdesk can report on almost anything: tags, channels, time-of-day breakdowns, reopen rates. Most of that does not belong on a wallboard. People read a wallboard in passing, in a second or two on the way to the coffee machine. If a number requires a sentence of explanation to interpret, put it in the weekly report.
The one exception is a per-inbox split when separate teams share the screen: billing and technical each need to see their own backlog, and a combined total can hide one team drowning while the other is idle. Tag and channel splits stay in the reports.
Why per-agent leaderboards backfire in a shared office
It's tempting to add a leaderboard: conversations handled per agent, ranked. In a shared office, people start gaming the number that's visible (closing conversations fast instead of well), and agents handling harder tickets look slower for reasons that have nothing to do with effort. It also turns a shared tool into a public scoreboard that nobody asked to be ranked on.
If leadership genuinely wants per-agent visibility, make it opt-in and keep it private. A manager can pull an individual report from the helpdesk directly. Keep the shared screen reporting on the queue, and leave individual performance to private conversations between a manager and an agent.
Set an amber bound so the wall only shouts when it needs to
A wallboard that stays red all day trains people to ignore it, and one that stays green all day gives no early warning. Agreeing on a threshold per metric, written down in your team agreement, means a change always signals something to act on.
As a starting point your team can adjust, treat unassigned above 5 as the amber line worth a glance. Set the final number yourselves based on staffing and volume, since only your team knows what a normal morning looks like. For waiting, the rule depends on what the number counts: if your tool counts only conversations past a target, flag it the moment it's above zero; if it counts every waiting conversation, pick a small number such as 3. For first reply time, set amber at your target and red at twice your target, so a 1-hour target means amber at 60 minutes and red at 120.
Thresholds like these let the screen sit quietly on a normal day and draw attention only when something needs a look. Whatever signage tool you use, check whether it supports conditional coloring or threshold alerts before assuming it does. If it doesn't, the written thresholds still work: everyone knows that 6 unassigned means someone picks up the next one.
A worked example
Say you lead a support team of six agents with two Help Scout inboxes, billing and technical, and one 43-inch TV mounted near the desks. Your target is a first reply within 1 hour.
- Thresholds: unassigned amber above 5, waiting red above 3, first reply time amber above 60 minutes and red above 120.
- Layout: combined totals for the whole team, with the dashboard's split per inbox showing how billing and technical each contribute. Because all six agents work both inboxes from one pool, the split line already shows where the backlog sits, and a rotation would only make each inbox's numbers disappear for part of every cycle.
- Hardware: a Raspberry Pi 4 behind the TV, or the TV's own browser if it's a recent smart TV.
- Cost on TVpilot: one screen fits the Free plan at €0. If you later add a second TV in the meeting area, the Starter plan at €5/month covers up to 5 screens.
Agree these lines as a team and read them off the numbers.
On a Tuesday morning the screen shows 3 unassigned and a 40-minute first reply time, so nobody reacts. By 11:00 it reads 7 unassigned, over the amber line, the per-inbox split shows most of them sit in billing, and the agent who notices takes the oldest one.
Pick a layout for your mailboxes
If you run one mailbox or one team, a single screen showing the seven numbers is all you need. Most support teams have more going on. Three layouts that work depending on team size:
- Combined: one wallboard that sums every mailbox and channel into one set of seven numbers. Good for a small team that works as one queue.
- One at a time: a rotation that shows mailbox A for a stretch, then mailbox B, then C. Good when distinct teams (billing, technical, sales) with their own agents share one TV but need each team's numbers to register rather than being averaged away.
- Side by side: two or three mailboxes shown on separate screens, so each team's numbers stay visible all the time. Good for a VIP queue next to general support.
In TVpilot, "one at a time" is a playlist: put the team's slides in order, use "apply to all" to give every slide the same duration, and the screen rotates through them in a loop. "Side by side" means one screen per team, each with its own playlist, managed from the same dashboard; up to 5 screens fit the Starter plan at €5/month. If you're not sure, start combined and split out a team once you notice its numbers getting lost in the total.
Refresh each number as often as it actually moves
Match the refresh to how fast a number changes and how fast someone would act on it. Queue counts (open, unassigned, waiting) move minute by minute and drive action, so refresh them about every 3 minutes. Nobody makes a decision based on a number that changed ten seconds ago, and a slower cycle puts less load on your helpdesk's API. New and solved today can share that cycle. First reply time is an average that shifts slowly through the day, and satisfaction moves slower still because ratings trickle in, so if your tool lets you set the interval per tile, hourly or daily is plenty for CSAT. If it uses one interval for everything, 3 minutes is a sensible single setting.
Privacy: totals only, never a name or a subject line
A support wallboard sits in a shared space, sometimes visible to visitors or other departments. It should never show a customer's name, email or the subject line of a conversation. Show counts and times only. This avoids an awkward moment when a customer's complaint about a specific order happens to be on screen while they walk past the office window. Whatever connects to your helpdesk should use credentials scoped as narrowly as the helpdesk allows, pulling aggregate numbers and never conversation content.
When TVpilot fits, and when it doesn't
TVpilot's helpdesk connection today is Help Scout, which puts the queue, speed and satisfaction numbers above on screen from one App ID and App Secret. When several teams watch one screen, use the per-inbox split and leave channel and tag splits for review meetings.
If your team runs on Zendesk, Freshdesk, Intercom or Trengo, check the support dashboards overview linked above for the current status of your helpdesk before planning a wallboard around it.
If you already pay for a dedicated dashboard product (the Geckoboard-style tools) and it's working, there's no reason to switch just for this. That's a fine way to run a wallboard too. TVpilot earns its place when you want the support wallboard on the same TV and the same dashboard you already use for other signage (a waiting room screen, a meeting room panel, a Shopify revenue wallboard), instead of paying for and managing a separate product just for the helpdesk. If you need deep historical analytics or custom queries across your support data, a BI tool will cover more ground than anything built for a TV on the wall.
Get your wallboard on the wall
For a closer look at the Help Scout connection, the Help Scout dashboard on TV setup guide walks through it step by step. When you're ready, sign up free and have your first support wallboard running on one TV at no cost on the Free plan.
Frequently asked questions
What should a support wallboard show?
Keep it to about seven numbers: open conversations, unassigned, waiting too long, new today, solved today, first reply time and satisfaction. Together they cover volume, backlog, speed and quality, and each can be read at a glance. Tag, channel and per-agent breakdowns belong in reports, not on the wall.
Should a helpdesk TV dashboard show per-agent stats?
In a shared office it usually shouldn't. A public leaderboard pushes people to close conversations fast instead of well, and agents with harder tickets look slower for reasons unrelated to effort. If per-agent visibility is wanted, make it opt-in and keep it in private reports between a manager and an agent.
How often should a support team dashboard on TV refresh?
About every 3 minutes for queue numbers like open, unassigned and waiting, which change often and drive action. First reply time and satisfaction move slowly, so hourly or daily is enough for those if your tool allows per-tile intervals. If it uses one interval for everything, 3 minutes is a sensible setting.
Is it safe to show helpdesk data on an office TV?
Yes, as long as the screen shows totals only: counts and times, never a customer's name, email address or conversation subject. Use credentials scoped as narrowly as your helpdesk allows so the connection pulls aggregate numbers rather than conversation content.